November 2023
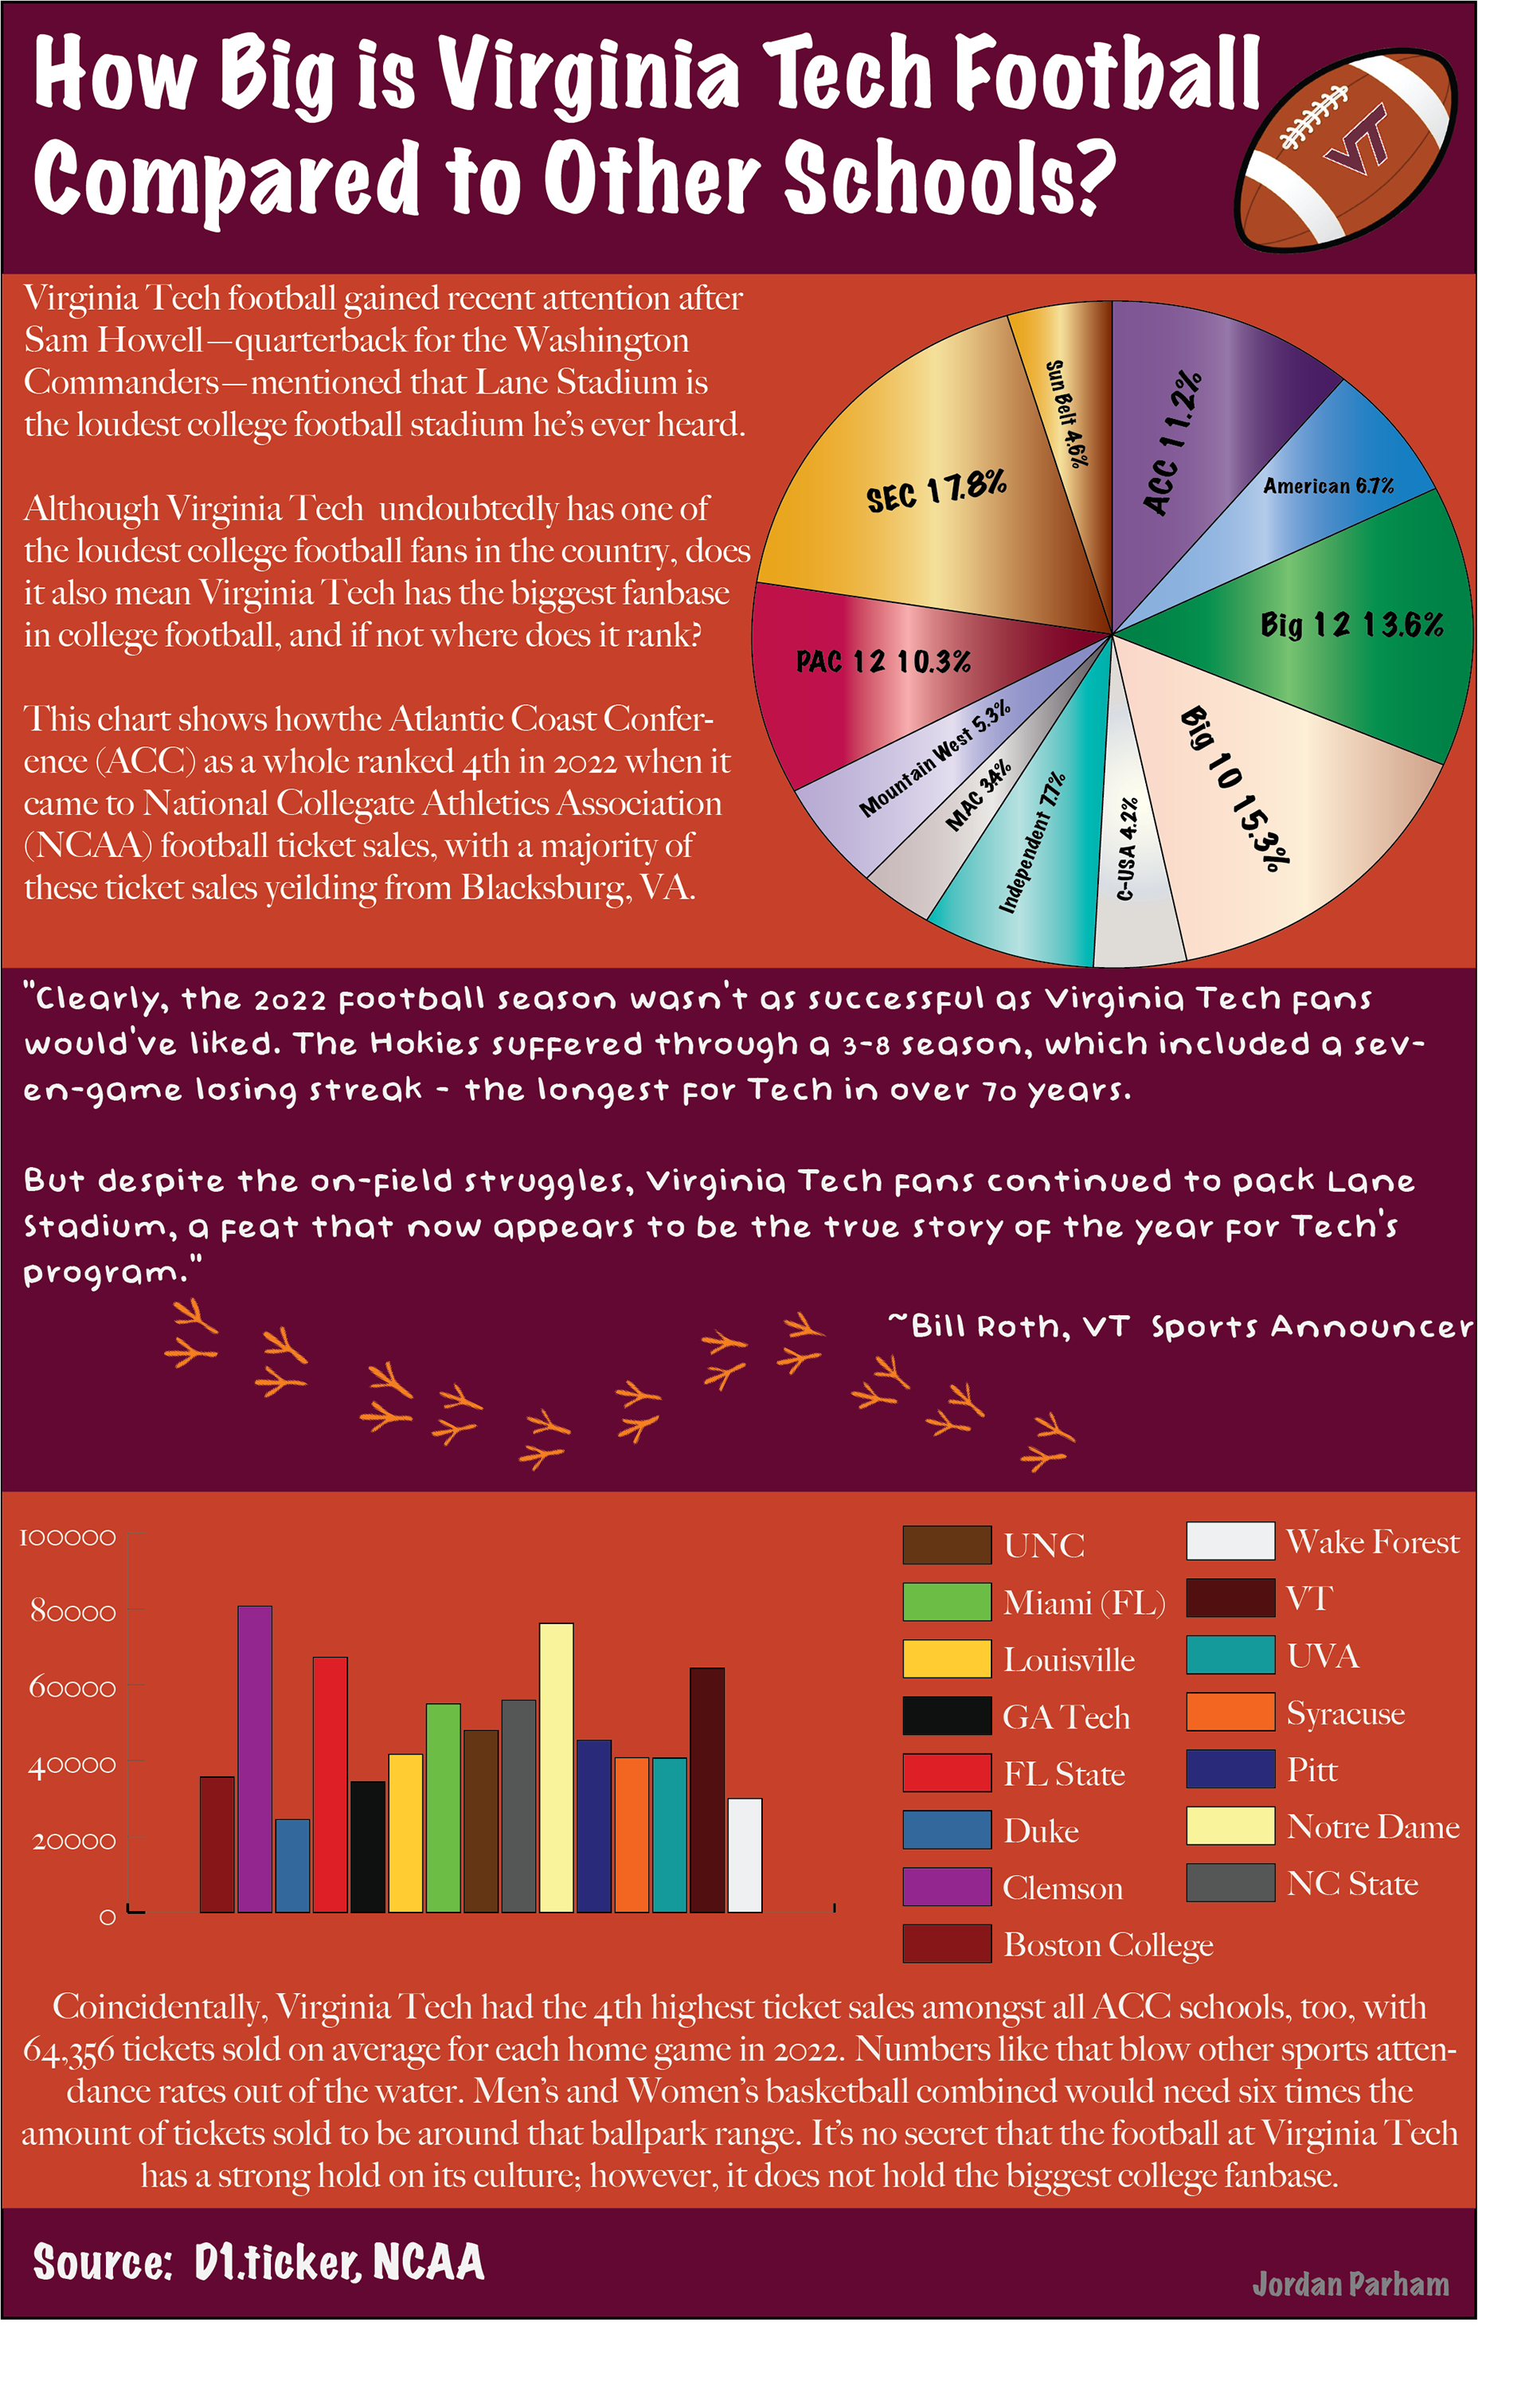
This project involved graphically displaying information about a sports topic to help people better understand it. I chose the topic ‘How big is Virginia Tech football compared to other schools?’ I produced the project using Adobe Illustrator and obtained the information from the NCAA website and a site called 'D1.Ticker.'
One interesting fact about Virginia Tech’s football popularity is that, on average, the school sells 64,365 game tickets per weekend. To put that into perspective, Lane Stadium, where the Hokies play, can hold 66,233 fans (that's about 97% of all tickets sold). Although the Hokies have not had the best records recently—in 2022, they only won three out of 11 games—their fans are still loyal and will come out to support their team no matter what.
A few challenges I had while completing this project were finding a newsworthy topic that I could make a graphic for and, once I found a topic, finding statistics to display the information. I did not want to do a topic that others might do for their project; I wanted to be original. This eventually led to me looking for great topics that had little information. As for finding the statistics, that was not hard. The hardest part was counting the number of ticket sales and converting them to a percentage—it took a full day to ensure accuracy.
I will use what I learned during this project to help make stunning graphics to display information others might not have thought about. This was, hands down, my favorite visual media project. Having a slight graphics design background it reminded me of when I used to make album covers for my friends. Although I knew how to match colors and arrange the design so it wouldn’t crowd the page, I learned how to size text and images better to give the graphic a look that’s appealing to others. I can definitely see myself making similar graphical analytics to this project in the future.
This was an example project I did in my Visual Media class. Although our professor had us follow her example on the projector, I enjoyed how it turned out and would like to display it!